Ajing Float Rigs and Carolina Rigs: Reaching Offshore Schools and Bigger Aji
minagiman
Minagiman's Fishing Adventures in Japan
“How many seconds should I count down?” Everyone asks that at first. But counting down is not just for sinking a lure. If you record the numbers, you can read the depth in front of you and even the structure where fish like to hold. Here is how to use the countdown in real fishing.
The key is knowing how many metres your lure sinks per second. Then seconds to bottom × sink rate = approximate depth. Change your casting distance as you count and the shape of the seabed appears.
| What you learn | How to use it |
|---|---|
| Depth | Choose lures and depth for the spot |
| Structure (drop-offs, channels, rocks) | Find the changes where fish hold |
| Current | A longer count than usual means the lure is being swept |
| Repeating a productive depth | Remember the count that caught a fish and fish it again |
Being able to repeat a productive count is a big advantage. Just remembering how long you let it sink when you got a fish can lead to the next one.
Sink rate is metres per second. Packaging or maker sites sometimes list it, but line diameter and how line comes off after the cast change it, so measuring with your own tackle is best.
| Example | Value |
|---|---|
| Depth at your feet | 5 m |
| Seconds to bottom (average of three) | 5 s |
| Sink rate | 5 m ÷ 5 s = 1 m/s |
These are example numbers to show the method; real sink rates depend on lure weight, shape and line. Measure on a free fall with the bail open so line flows freely; bottom is the moment the line stops.
A lure cast out does not sink as fast as one dropped at your feet. If it sinks on a tight line (curve or tension fall), it swings towards you in an arc and sinks more slowly.
| Fall | Speed | Feature |
|---|---|---|
| Free fall | Fast | Sinks almost straight down as line pays out; good for measuring depth |
| Curve fall | Slow | Swings towards you as it sinks; longer time to attract fish |
To measure depth, leave the bail open after splashdown and let line pay out. Wind or waves bowing the line add error, so cast several times and look at the average. See also Japanese metal jigs guide.
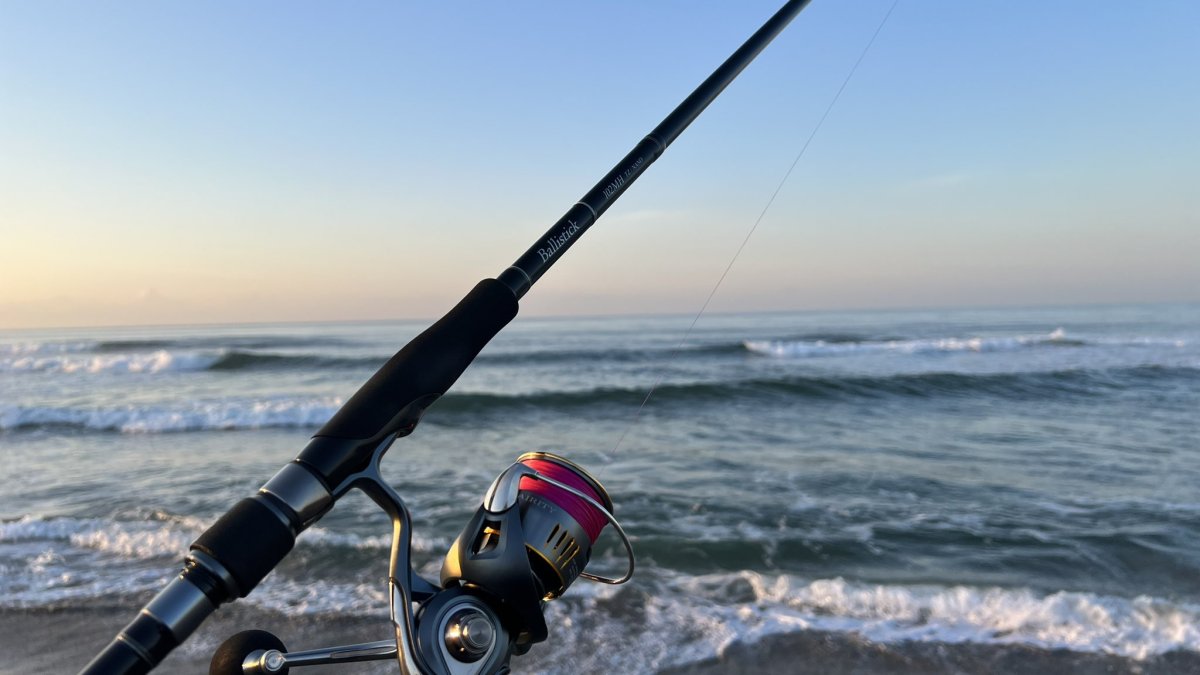
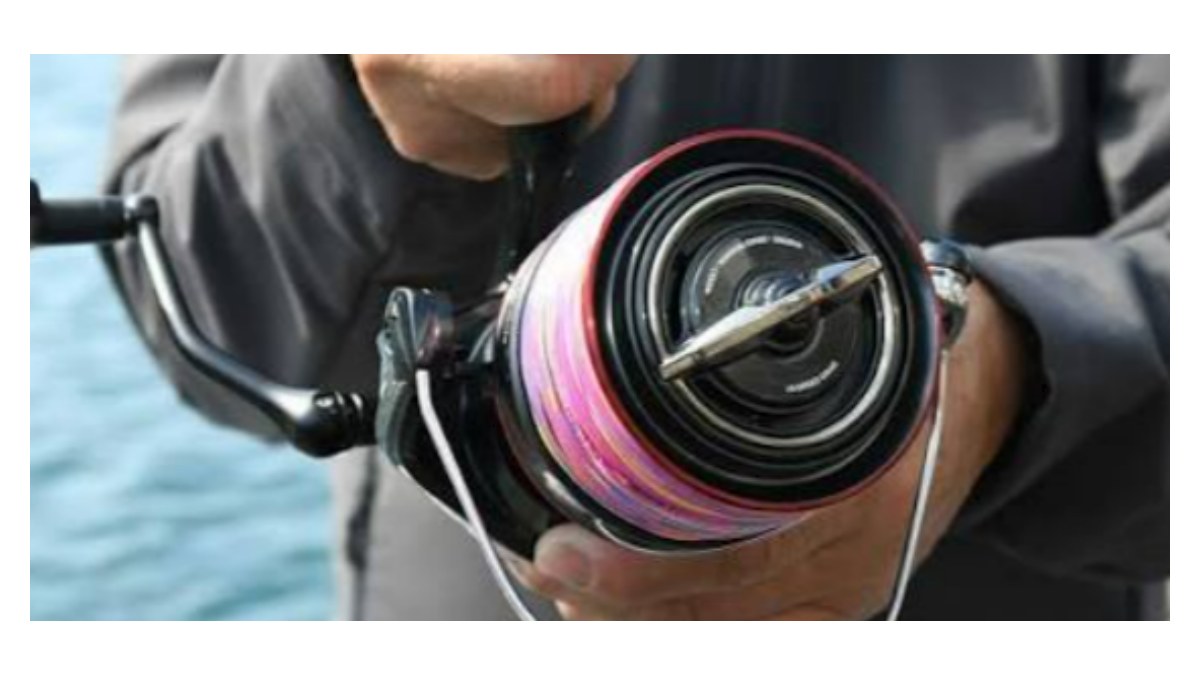
To read structure, you also need to know where the lure hit bottom. Multi-colour PE that changes every 10 m helps: count the colours that left the spool for an approximate cast distance. Five colours out means about 50 m. Line with 1 m markers gives finer detail.
| Line type | What it shows | Example |
|---|---|---|
| Colour change every 10 m | Distance in 10 m steps | Daiwa UVF PE Dura Sensor x8+Si2 multicolour |
| 10 m colours + 1 m marks | Distance to the metre | Daiwa UVF PE Dura Sensor x12EX+Si3 (5C) |
| Mark every 1 m | Distance to the metre | X-Braid Upgrade X8 (marked) |
Noting which colour is at the water surface when the lure touches down tells you how far out it hit bottom: a key clue for reading structure.
When you stop the lure and let it sink mid-retrieve, it may drift further out or towards you, so treat the results as a guide.
| Distance from you | Count to bottom | Approx. depth | Note |
|---|---|---|---|
| 60 m | 8 s | about 8 m | |
| 50 m | 8 s | about 8 m | |
| 40 m | 5 s | about 5 m | Suddenly shallower: drop-off |
| 30 m | 4 s | about 4 m | |
| 20 m | 3 s | about 3 m | Snaggy feel: rocks? |
| 10 m | 2 s | about 2 m |
This example assumes 1 m/s sink rate; the numbers are illustrative. Here the depth jumps from about 8 m to 5 m between 50 and 40 m: that is a break (drop-off), where flounder, flathead and blue-water fish often ambush bait.
| Count change | Likely structure | How to fish it |
|---|---|---|
| Count suddenly drops at one distance | Drop-off (break) | Retrieve over the top of the break |
| Count rises in one area | Channel or hole | Work slowly through the channel |
| Different counts by direction | Rip current, cove, structural change | Focus on the deeper direction |
| Rough feel or snags | Rocks, reef, debris | Lift the lure before the rocks |
See also how to read a surf beach.
Counting speed varies between people and moods. Use a rhythm close to one second, such as “one-and, two-and”, and calibrate it once against a watch or phone stopwatch.
Fast current or crosswind bowing the line lengthens the count. If it seems longer than usual, use a heavier jig or change direction.
Note the direction, how many colours you cast and how long you let it sink. Repeat those conditions to fish the same depth and structure again.
Read the structure with the countdown while it is still dark, and you can hit the best spot immediately in the short dawn feeding window.
For reading structure, PE that changes colour every 10 m is almost essential; 1 m marked line helps for more detail. On the surf, the further you cast, the harder bottom is to feel, so pair sensitive PE with a heavier jig that finds bottom easily.
The countdown is not just a way to decide how long to let a lure sink; it is a tool for drawing a map of the sea in front of you. A surf beach looks uniform, but recorded numbers reveal drop-offs, channels and deeper directions. Once you know the structure, you can put your lure where fish are likely to be. It feels like a chore at first, but record a spot once and you can start fishing it straight away next time. On your next trip, spend your first five casts mapping the bottom.